Comparer for protein structure rankings
Qian, J. et.al (2001) Nucleic Acids Research 29: 1750-64|
[First 30 records][Entire table] [Display values][Display ranks] Image size: [50][70][100][120] | S(all) seq. identity | X(age) year of fold determined | B(Trp,pdb40) composition percentage of Trp for pdb40d | B(Ser,pdb100) composition percentage of Ser for pdb100d | B(Trp,pdb100) composition percentage of Trp for pdb100d | |
| Max in column | 216 | 420 | 360 | 418 | 370 | |
| Min in column | 1 | 1 | 1 | 1 | 1 | |
| Average | 108.5 | 192.0 | 195.8 | 207.4 | 202.0 | |
| Non zero hits | 216 | 420 | 408 | 420 | 420 | |
| Ranked folds (click on arrows to re-rank) |  |  | | | | |
 | | | | | ||
d2prk__:. (1.39) |  | 11 | 420 | 324 | 2 | 238 |
d1hlm__:. (1.39) |  | . | 419 | 204 | 235 | 197 |
d1eny__:. (1.39) |  | 144 | 417 | 283 | 166 | 277 |
d1llc_2:. (1.39) | 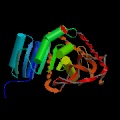 | 82 | 417 | 222 | 166 | 164 |
d153l__:. (1.39) |  | 28 | 412 | 95 | 288 | 46 |
d1dst__:. (1.39) |  | 66 | 412 | 82 | 43 | 60 |
d1hpi__:. (1.39) |  | . | 412 | 12 | 305 | 21 |
d1yna__:. (1.39) |  | 99 | 412 | 65 | 12 | 84 |
d1drw_2:. (1.39) |  | 30 | 412 | 161 | 152 | 238 |
d2a0b__:. (1.39) |  | 119 | 403 | 186 | 333 | 197 |
d1uch__:. (1.39) | 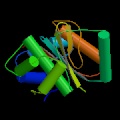 | 73 | 403 | 82 | 103 | 56 |
d1mek__:. (1.39) |  | 86 | 403 | 204 | 255 | 133 |
d1vpe__:. (1.39) |  | 18 | 403 | 324 | 175 | 338 |
d1ajw__:. (1.39) |  | 38 | 403 | 118 | 8 | 100 |
d1xjo__:. (1.39) |  | 158 | 403 | 222 | 96 | 164 |
d1gks__:. (1.39) | 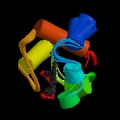 | 111 | 403 | 261 | 347 | 222 |
d2aw0__:. (1.39) |  | 200 | 403 | 261 | 299 | 197 |
d1aj2__:. (1.39) |  | 171 | 403 | 118 | 266 | 133 |
d1rhs__:. (1.39) |  | . | 401 | 38 | 96 | 46 |
d1kul__:. (1.39) |  | 47 | 401 | 65 | 310 | 121 |
d2itg__:. (1.39) |  | 195 | 400 | 135 | 288 | 144 |
d1cyx__:. (1.39) |  | 90 | 396 | 149 | 235 | 197 |
d1pkm_1:. (1.39) |  | 26 | 396 | 324 | 333 | 363 |
d1erh__:. (1.39) |  | . | 396 | 261 | 145 | 222 |
d1pkm_3:. (1.39) | | 34 | 396 | 283 | 136 | 307 |
d2plh__:. (1.39) |  | . | 392 | 360 | 166 | 370 |
d1une__:. (1.39) |  | 33 | 392 | 222 | 121 | 222 |
d1tcp__:. (1.39) |  | . | 392 | 118 | 359 | 307 |
d1gab__:. (1.39) |  | . | 392 | 360 | 245 | 338 |
d2prd__:. (1.39) |  | 203 | 381 | 222 | 175 | 238 |
The images of protein structures were taken from www.rcsb.org
The classification of folds is from SCOP version 1.39
Questions, comments, and suggestions qian@csb.yale.edu