Comparer for protein structure rankings
Qian, J. et.al (2001) Nucleic Acids Research 29: 1750-64|
[First 30 records][Entire table] [Display values][Display ranks] Image size: [50][70][100][120] | S(all) seq. identity | X(age) year of fold determined | B(Trp,pdb40) composition percentage of Trp for pdb40d | B(Ser,pdb100) composition percentage of Ser for pdb100d | B(Trp,pdb100) composition percentage of Trp for pdb100d | |
| Max in column | 216 | 420 | 360 | 418 | 370 | |
| Min in column | 1 | 1 | 1 | 1 | 1 | |
| Average | 108.5 | 192.0 | 195.8 | 207.4 | 202.0 | |
| Non zero hits | 216 | 420 | 408 | 420 | 420 | |
| Ranked folds (click on arrows to re-rank) |  | | | | | |
 |  | | | | ||
d1a6ja_:. (1.39) |  | . | 1 | 360 | 220 | 370 |
d1sknp_:. (1.39) |  | . | 1 | . | 10 | 370 |
d1a5t_1:. (1.39) |  | . | 1 | 50 | 162 | 60 |
d1gc1g_:. (1.39) | . | 1 | 65 | 38 | 76 | |
d1a68__:. (1.39) |  | . | 1 | 360 | 330 | 370 |
d1a6q__:. (1.39) |  | . | 1 | 240 | 90 | 238 |
d2bbg__:. (1.39) |  | . | 1 | 6 | 162 | 197 |
d1a74a_:. (1.39) |  | . | 1 | 27 | 383 | 25 |
d1jdbb2:. (1.39) |  | . | 9 | 360 | 316 | 370 |
d1vgh__:. (1.39) |  | . | 9 | . | 220 | 370 |
d1ap8__:. (1.39) |  | . | 9 | 15 | 59 | 17 |
d1lkte_:. (1.39) | 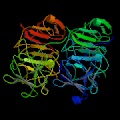 | . | 9 | 360 | 184 | 370 |
d2pil__:. (1.39) |  | . | 9 | 95 | 166 | 100 |
d1soxa3:. (1.39) |  | . | 9 | 50 | 145 | 60 |
d1aa7a_:. (1.39) |  | . | 9 | 310 | 152 | 307 |
d1agre_:. (1.39) |  | . | 9 | 240 | 2 | 238 |
d1ab3__:. (1.39) |  | 52 | 9 | 310 | 204 | 277 |
d1jdw__:. (1.39) |  | . | 9 | 45 | 245 | 53 |
d1abv__:. (1.39) |  | . | 9 | 293 | 129 | 292 |
d1aj6__:. (1.39) | 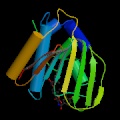 | 60 | 9 | 341 | 90 | 320 |
d2hp8__:. (1.39) |  | . | 9 | 360 | 35 | 370 |
d1uag_1:. (1.39) | 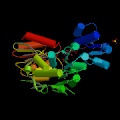 | . | 9 | 222 | 232 | 222 |
d1lre__:. (1.39) |  | . | 9 | 47 | 418 | 56 |
d1al01_:. (1.39) |  | . | 9 | 293 | 347 | 292 |
d1aa2__:. (1.39) |  | . | 9 | 118 | 245 | 121 |
d1auz__:. (1.39) |  | 214 | 9 | 310 | 38 | 320 |
d1a1x__:. (1.39) |  | 50 | 9 | 16 | 310 | 11 |
d1fsz_1:. (1.39) | 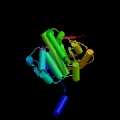 | . | 9 | 360 | 394 | 370 |
d2prp__:. (1.39) |  | . | 9 | 240 | 359 | 197 |
d1ahja_:. (1.39) |  | . | 9 | 31 | 322 | 31 |
The images of protein structures were taken from www.rcsb.org
The classification of folds is from SCOP version 1.39
Questions, comments, and suggestions qian@csb.yale.edu