Comparer for protein structure rankings
Qian, J. et.al (2001) Nucleic Acids Research 29: 1750-64|
[First 30 records][Entire table] [Display values][Display ranks] Image size: [50][70][100][120] | S(all) seq. identity | X(age) year of fold determined | B(Trp,pdb40) composition percentage of Trp for pdb40d | B(Ser,pdb100) composition percentage of Ser for pdb100d | B(Trp, pdb100) composition percentage of Trp for pdb100d | |
| Max in column | 216 | 420 | 360 | 418 | 370 | |
| Min in column | 1 | 1 | 1 | 1 | 1 | |
| Average | 108.5 | 192.0 | 195.8 | 207.4 | 202.0 | |
| Non zero hits | 216 | 420 | 408 | 420 | 420 | |
| Ranked folds (click on arrows to re-rank) |  | | | |  | |
 | | | | | ||
d1fipa_:. (1.39) |  | . | 285 | 360 | 333 | 370 |
d1bno__:. (1.39) |  | 4 | 187 | . | 363 | 370 |
d1bbl__:. (1.39) |  | . | 255 | . | 347 | 370 |
d1crka1:. (1.39) |  | . | 56 | 360 | 383 | 370 |
d1aqt__:. (1.39) |  | . | 9 | 360 | 141 | 370 |
d1dkga2:. (1.39) |  | . | 9 | 360 | 412 | 370 |
d1pxta1:. (1.39) | . | 187 | 360 | 266 | 370 | |
d1kwaa_:. (1.39) |  | 124 | 56 | 360 | 204 | 370 |
d1ycra_:. (1.39) |  | 7 | 56 | 360 | 22 | 370 |
d2rsla_:. (1.39) |  | . | 223 | 360 | 103 | 370 |
d1rpo__:. (1.39) |  | . | 285 | . | 288 | 370 |
d1div__:. (1.39) | 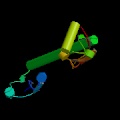 | . | 56 | 360 | 407 | 370 |
d1ccd__:. (1.39) |  | 19 | 332 | 360 | 54 | 370 |
d1tih__:. (1.39) |  | . | 381 | 360 | 69 | 370 |
d2plh__:. (1.39) |  | . | 392 | 360 | 166 | 370 |
d1a68__:. (1.39) |  | . | 1 | 360 | 330 | 370 |
d1bco_1:. (1.39) |  | . | 119 | 360 | 355 | 370 |
d1beo__:. (1.39) |  | . | 56 | 360 | 6 | 370 |
d1tbd__:. (1.39) |  | . | 56 | . | 9 | 370 |
d1mnma_:. (1.39) |  | 8 | 119 | 360 | 193 | 370 |
d1tafb_:. (1.39) |  | 120 | 119 | 360 | 204 | 370 |
d1zer__:. (1.39) |  | 39 | 255 | 360 | 90 | 370 |
d1agi__:. (1.39) |  | 51 | 372 | 349 | 7 | 370 |
d1npoa_:. (1.39) |  | . | 306 | 360 | 152 | 370 |
d1aie__:. (1.39) |  | . | 187 | 360 | 418 | 370 |
d1fsz_1:. (1.39) | 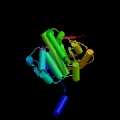 | . | 9 | 360 | 394 | 370 |
d1ctf__:. (1.39) |  | . | 368 | 360 | 394 | 370 |
d1fts_1:. (1.39) |  | 98 | 56 | 360 | 370 | 370 |
d1afp__:. (1.39) |  | . | 187 | . | 347 | 370 |
d1eft_2:. (1.39) |  | 5 | 223 | 360 | 411 | 370 |
The images of protein structures were taken from www.rcsb.org
The classification of folds is from SCOP version 1.39
Questions, comments, and suggestions qian@csb.yale.edu