Comparer for protein structure rankings
Qian, J. et.al (2001) Nucleic Acids Research 29: 1750-64|
[First 30 records][Entire table] [Display values][Display ranks] Image size: [50][70][100][120] | S(all) seq. identity | X(age) year of fold determined | B(Trp,pdb40) composition percentage of Trp for pdb40d | B(Ser, pdb100) composition percentage of Ser for pdb100d | B(Trp,pdb100) composition percentage of Trp for pdb100d | |
| Max in column | 216 | 420 | 360 | 418 | 370 | |
| Min in column | 1 | 1 | 1 | 1 | 1 | |
| Average | 108.5 | 192.0 | 195.8 | 207.4 | 202.0 | |
| Non zero hits | 216 | 420 | 408 | 420 | 420 | |
| Ranked folds (click on arrows to re-rank) |  | | |  | | |
 | | | | | ||
d1aaf__:. (1.39) |  | . | 306 | . | 418 | 110 |
d1aie__:. (1.39) |  | . | 187 | 360 | 418 | 370 |
d1lre__:. (1.39) |  | . | 9 | 47 | 418 | 56 |
d1orda3:. (1.39) | 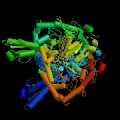 | . | 119 | 310 | 417 | 307 |
d1lis__:. (1.39) | 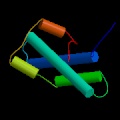 | . | 223 | 31 | 416 | 31 |
d1mut__:. (1.39) |  | . | 119 | 12 | 414 | 14 |
d1atb__:. (1.39) |  | . | 187 | 135 | 414 | 133 |
d1dkga2:. (1.39) |  | . | 9 | 360 | 412 | 370 |
d2abk__:. (1.39) | 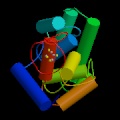 | 180 | 119 | 82 | 412 | 60 |
d1eft_2:. (1.39) |  | 5 | 223 | 360 | 411 | 370 |
d1tfe__:. (1.39) |  | 142 | 56 | 360 | 409 | 351 |
d2masa_:. (1.39) |  | . | 119 | 310 | 409 | 307 |
d1rss__:. (1.39) |  | 14 | 9 | 186 | 407 | 182 |
d1div__:. (1.39) | 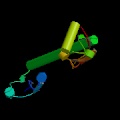 | . | 56 | 360 | 407 | 370 |
d1alo_3:. (1.39) |  | 151 | 306 | 204 | 404 | 182 |
d1oaca4:. (1.39) |  | . | 119 | 59 | 404 | 68 |
d1mkaa_:. (1.39) | 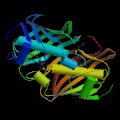 | . | 56 | 109 | 404 | 110 |
d1mhyg_:. (1.39) |  | 21 | 187 | 95 | 402 | 133 |
d2chsa_:. (1.39) | 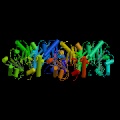 | 208 | 187 | 283 | 402 | 277 |
d1aora1:. (1.39) |  | . | 119 | 186 | 401 | 182 |
d1ad2__:. (1.39) |  | . | 9 | 341 | 396 | 338 |
d1pysb2:. (1.39) |  | . | 56 | 293 | 396 | 292 |
d1jdbb1:. (1.39) |  | . | 9 | 186 | 396 | 182 |
d1rvv1_:. (1.39) |  | . | 119 | 310 | 396 | 307 |
d1cuk_2:. (1.39) |  | . | 56 | 360 | 396 | 370 |
d1fsz_1:. (1.39) | 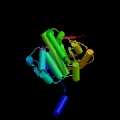 | . | 9 | 360 | 394 | 370 |
d1ctf__:. (1.39) |  | . | 368 | 360 | 394 | 370 |
d1dun__:. (1.39) | 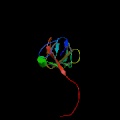 | 174 | 119 | 293 | 392 | 351 |
d1fwfc1:. (1.39) |  | . | 119 | 118 | 392 | 121 |
d1aop_4:. (1.39) |  | . | 9 | 149 | 390 | 144 |
The images of protein structures were taken from www.rcsb.org
The classification of folds is from SCOP version 1.39
Questions, comments, and suggestions qian@csb.yale.edu