Comparer for protein structure rankings
Qian, J. et.al (2001) Nucleic Acids Research 29: 1750-64|
[First 30 records][Entire table] [Display values][Display ranks] Image size: [50][70][100][120] | S(all) seq. identity | X(age) year of fold determined | B(Trp,pdb40) composition percentage of Trp for pdb40d | B(Ser,pdb100) composition percentage of Ser for pdb100d | B(Trp, pdb100) composition percentage of Trp for pdb100d | |
| Max in column | 216 | 420 | 360 | 418 | 370 | |
| Min in column | 1 | 1 | 1 | 1 | 1 | |
| Average | 108.5 | 192.0 | 195.8 | 207.4 | 202.0 | |
| Non zero hits | 216 | 420 | 408 | 420 | 420 | |
| Ranked folds (click on arrows to re-rank) |  | | | | | |
 | | | |  | ||
d1lghb_:. (1.39) |  | . | 56 | 1 | 235 | 1 |
d1aol__:. (1.39) |  | . | 9 | 2 | 15 | 2 |
d1a91__:. (1.39) | . | 346 | 10 | 220 | 3 | |
d1occh_:. (1.39) |  | . | 56 | 4 | 175 | 4 |
d1smpi_:. (1.39) |  | 138 | 255 | 16 | 59 | 5 |
d1avma2:. (1.39) |  | 32 | 285 | 3 | 333 | 5 |
d1fmta1:. (1.39) |  | . | 9 | 5 | 82 | 5 |
d1qnf_1:. (1.39) | 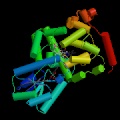 | 24 | 119 | 9 | 316 | 8 |
d1ecib_:. (1.39) | 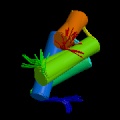 | . | 119 | . | 204 | 9 |
d1ulo__:. (1.39) |  | 167 | 223 | 29 | 49 | 9 |
d1fid__:. (1.39) |  | . | 56 | 10 | 220 | 11 |
d1a1x__:. (1.39) |  | 50 | 9 | 16 | 310 | 11 |
d1tpg_2:. (1.39) |  | . | 223 | 7 | 17 | 11 |
d2reb_2:. (1.39) | 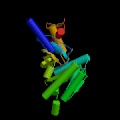 | . | 285 | 7 | 281 | 14 |
d1mut__:. (1.39) |  | . | 119 | 12 | 414 | 14 |
d1prea2:. (1.39) |  | . | 119 | 12 | 45 | 14 |
d1ap8__:. (1.39) |  | . | 9 | 15 | 59 | 17 |
d1apf__:. (1.39) |  | . | 346 | 18 | 220 | 17 |
d1ak0__:. (1.39) |  | 202 | 9 | 20 | 66 | 19 |
d1brsd_:. (1.39) |  | . | 223 | 21 | 204 | 20 |
d1prn__:. (1.39) |  | . | 255 | 65 | 136 | 21 |
d1hpi__:. (1.39) |  | . | 412 | 12 | 305 | 21 |
d1rblm_:. (1.39) |  | 16 | 306 | 23 | 376 | 21 |
d1mdal_:. (1.39) |  | . | 255 | 25 | 82 | 24 |
d1pex__:. (1.39) |  | 75 | 119 | 25 | 245 | 25 |
d1har__:. (1.39) |  | . | 354 | 65 | 355 | 25 |
d1a74a_:. (1.39) |  | . | 1 | 27 | 383 | 25 |
d2nef__:. (1.39) |  | . | 56 | 23 | 370 | 28 |
d1pcfa_:. (1.39) |  | . | 9 | 29 | 162 | 28 |
d1ld9a2:. (1.39) |  | 36 | 354 | 18 | 232 | 28 |
The images of protein structures were taken from www.rcsb.org
The classification of folds is from SCOP version 1.39
Questions, comments, and suggestions qian@csb.yale.edu