Comparer for protein structure rankings
Qian, J. et.al (2001) Nucleic Acids Research 29: 1750-64|
[First 30 records][Entire table] [Display values][Display ranks] Image size: [50][70][100][120] | S(all) seq. identity | X(age) year of fold determined | B(Trp,pdb40) composition percentage of Trp for pdb40d | B(Ser,pdb100) composition percentage of Ser for pdb100d | B(Trp,pdb100) composition percentage of Trp for pdb100d | |
| Max in column | 216 | 420 | 360 | 418 | 370 | |
| Min in column | 1 | 1 | 1 | 1 | 1 | |
| Average | 108.5 | 192.0 | 195.8 | 207.4 | 202.0 | |
| Non zero hits | 216 | 420 | 408 | 420 | 420 | |
| Ranked folds (click on arrows to re-rank) |  | | | | | |
 |  | | | | ||
d1hoe__:. (1.39) |  | 1 | 332 | 161 | 121 | 164 |
d1aco_2:. (1.39) |  | 2 | 306 | 261 | 266 | 256 |
d2sici_:. (1.39) |  | 3 | 285 | 261 | 69 | 256 |
d1bno__:. (1.39) |  | 4 | 187 | . | 363 | 370 |
d1eft_2:. (1.39) |  | 5 | 223 | 360 | 411 | 370 |
d1gpl_1:. (1.39) |  | 6 | 223 | 149 | 73 | 133 |
d1ycra_:. (1.39) |  | 7 | 56 | 360 | 22 | 370 |
d1mnma_:. (1.39) |  | 8 | 119 | 360 | 193 | 370 |
d1gia_1:. (1.39) |  | 9 | 187 | 283 | 204 | 277 |
d1sat_1:. (1.39) |  | 10 | 187 | 261 | 22 | 197 |
d2prk__:. (1.39) |  | 11 | 420 | 324 | 2 | 238 |
d1an7a_:. (1.39) |  | 12 | 56 | 293 | 376 | 338 |
d3pfk__:. (1.39) |  | 13 | 346 | 349 | 333 | 351 |
d1rss__:. (1.39) |  | 14 | 9 | 186 | 407 | 182 |
d1puc__:. (1.39) |  | 15 | 223 | 95 | 220 | 76 |
d1rblm_:. (1.39) |  | 16 | 306 | 23 | 376 | 21 |
d1thw__:. (1.39) |  | 17 | 332 | 161 | 145 | 84 |
d1vpe__:. (1.39) |  | 18 | 403 | 324 | 175 | 338 |
d1ccd__:. (1.39) |  | 19 | 332 | 360 | 54 | 370 |
d1agx__:. (1.39) |  | 20 | 223 | 204 | 156 | 292 |
d1mhyg_:. (1.39) |  | 21 | 187 | 95 | 402 | 133 |
d2cts__:. (1.39) |  | 22 | 374 | 82 | 110 | 84 |
d1trla_:. (1.39) | 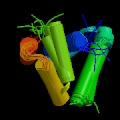 | 23 | 381 | 240 | 22 | 307 |
d1qnf_1:. (1.39) | 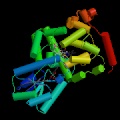 | 24 | 119 | 9 | 316 | 8 |
d1eaf__:. (1.39) |  | 25 | 332 | 222 | 175 | 238 |
d1pkm_1:. (1.39) |  | 26 | 396 | 324 | 333 | 363 |
d1avc__:. (1.39) |  | 26 | 285 | 310 | 141 | 351 |
d153l__:. (1.39) |  | 28 | 412 | 95 | 288 | 46 |
d1msc__:. (1.39) |  | 29 | 187 | 283 | 12 | 144 |
d1drw_2:. (1.39) |  | 30 | 412 | 161 | 152 | 238 |
The images of protein structures were taken from www.rcsb.org
The classification of folds is from SCOP version 1.39
Questions, comments, and suggestions qian@csb.yale.edu