Comparer for protein structure rankings
Qian, J. et.al (2001) Nucleic Acids Research 29: 1750-64|
[First 30 records][Entire table] [Display values][Display ranks] Image size: [50][70][100][120] | B(Ile, pdb100) composition percentage of Ile for pdb100d | |
| Max in column | 12.5 | |
| Min in column | 0.4 | |
| Average | 5.4 | |
| Non zero hits | 417 | |
| Ranked folds (click on arrows to re-rank) |  | |
 | ||
d1lkte_:. (1.39) | 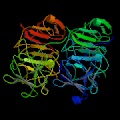 | 12.5 |
d1ecib_:. (1.39) | 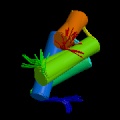 | 11.3 |
d2fmr__:. (1.39) |  | 11.1 |
d5csma_:. (1.39) |  | 10.5 |
d1an7a_:. (1.39) |  | 10.5 |
d1fwfc1:. (1.39) |  | 10.5 |
d1rvv1_:. (1.39) |  | 10.4 |
d1mat__:. (1.39) |  | 10.1 |
d1kwaa_:. (1.39) |  | 10.0 |
d1bmfg_:. (1.39) | 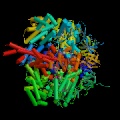 | 9.9 |
d1f3z__:. (1.39) |  | 9.8 |
d2def__:. (1.39) |  | 9.5 |
d2end__:. (1.39) | 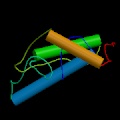 | 9.4 |
d1azo__:. (1.39) |  | 9.2 |
d1pcfa_:. (1.39) |  | 9.1 |
d3pfk__:. (1.39) |  | 9.1 |
d1cby__:. (1.39) | 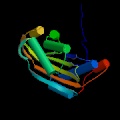 | 8.9 |
d1aj6__:. (1.39) | 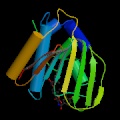 | 8.9 |
d1a26_1:. (1.39) | 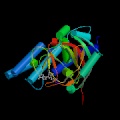 | 8.9 |
d1ass__:. (1.39) | 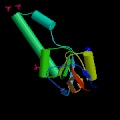 | 8.7 |
d1pkp_1:. (1.39) |  | 8.7 |
d1oroa_:. (1.39) |  | 8.7 |
d3pmga3:. (1.39) |  | 8.6 |
d1ak4c_:. (1.39) |  | 8.5 |
d3cms__:. (1.39) |  | 8.5 |
d1lci__:. (1.39) |  | 8.5 |
d1bno__:. (1.39) |  | 8.4 |
d1lghb_:. (1.39) |  | 8.3 |
d1a3ga_:. (1.39) |  | 8.3 |
d1pxta1:. (1.39) | 8.2 | |
The images of protein structures were taken from www.rcsb.org
The classification of folds is from SCOP version 1.39
Questions, comments, and suggestions qian@csb.yale.edu