Phenotype Clusters Help Page
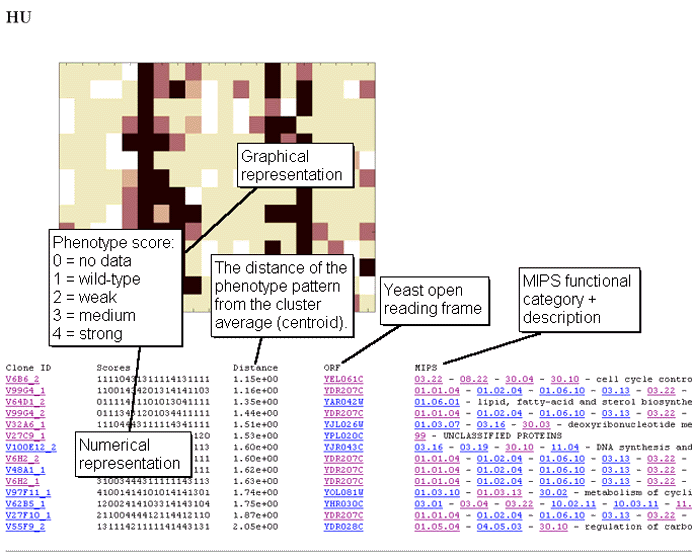
How to read the information. For example:

The phenotype scores for the different growth conditions are ordered from left to right as in table 1 from bottom to top. The tree to the left of the table indicates which growth conditions give rise to the same phenotype on average.

Table 1
Back to Phenotype Home
Gerstein Lab
Snyder Lab