Comparer for protein structure rankings
Qian, J. et.al (2001) Nucleic Acids Research 29: 1750-64|
[First 30 records][Entire table] [Display values][Display ranks] Image size: [50][70][100][120] | B(Trp, pdb40) composition percentage of Trp for pdb40d | |
| Max in column | 6.9 | |
| Min in column | 0.2 | |
| Average | 1.6 | |
| Non zero hits | 359 | |
| Ranked folds (click on arrows to re-rank) |  | |
 | ||
d1lghb_:. (1.39) |  | 6.9 |
d1aol__:. (1.39) |  | 5.7 |
d1avma2:. (1.39) |  | 5.2 |
d1occh_:. (1.39) |  | 4.7 |
d1fmta1:. (1.39) | 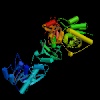 | 4.6 |
d2bbg__:. (1.39) |  | 4.4 |
d1tpg_2:. (1.39) |  | 4.3 |
d2reb_2:. (1.39) |  | 4.3 |
d1qnf_1:. (1.39) |  | 4.1 |
d1a91__:. (1.39) | 4.0 | |
d1fid__:. (1.39) |  | 4.0 |
d1prea2:. (1.39) |  | 3.9 |
d1hpi__:. (1.39) |  | 3.9 |
d1mut__:. (1.39) |  | 3.9 |
d1ap8__:. (1.39) |  | 3.8 |
d1a1x__:. (1.39) |  | 3.7 |
d1smpi_:. (1.39) |  | 3.7 |
d1ld9a2:. (1.39) |  | 3.6 |
d1apf__:. (1.39) |  | 3.6 |
d1ak0__:. (1.39) |  | 3.5 |
d1brsd_:. (1.39) |  | 3.4 |
d1tsg__:. (1.39) |  | 3.4 |
d1rblm_:. (1.39) |  | 3.3 |
d2nef__:. (1.39) |  | 3.3 |
d1mdal_:. (1.39) | 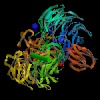 | 3.2 |
d1pex__:. (1.39) |  | 3.2 |
d1a74a_:. (1.39) |  | 3.1 |
d4aaha_:. (1.39) |  | 3.1 |
d1pcfa_:. (1.39) |  | 3.0 |
d1ulo__:. (1.39) | 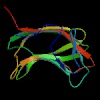 | 3.0 |
The images of protein structures were taken from www.rcsb.org
The classification of folds is from SCOP version 1.39
Questions, comments, and suggestions qian@csb.yale.edu