Comparer for protein structure rankings
Qian, J. et.al (2001) Nucleic Acids Research 29: 1750-64|
[First 30 records][Entire table] [Display values][Display ranks] Image size: [50][70][100][120] | Q(foldonly) P-value (seq. DE) | F(cdc28) fluctuation of expression levels in CDC28 | X(age) year of fold determined | B(Ala, pdb100) composition percentage of Ala for pdb100d | J(scerall,intra) interaction on same chains [yeast] | |
| Max in column | 1 | 0.91 | 98 | 23.0 | 44 | |
| Min in column | 9.97E-01 | 0.05 | 72 | 1.3 | 1 | |
| Average | 1.0 | 0.3 | 91.9 | 8.4 | 4.9 | |
| Non zero hits | 56 | 126 | 420 | 420 | 111 | |
| Ranked folds (click on arrows to re-rank) |  | | | | | |
 | | |  | | ||
d1ctf__:. (1.39) |  | . | - | 86 | 23.0 | . |
d1pprm2:. (1.39) |  | . | . | 96 | 18.6 | . |
d1aep__:. (1.39) |  | . | . | 92 | 18.6 | . |
d1hpi__:. (1.39) |  | . | . | 75 | 18.4 | . |
d1abv__:. (1.39) |  | . | - | 97 | 17.9 | . |
d1lghb_:. (1.39) |  | . | . | 96 | 16.8 | . |
d1aln_2:. (1.39) |  | . | - | 95 | 16.0 | 1 |
d1mla_1:. (1.39) |  | . | 0.15 | 95 | 15.7 | . |
d1aua_1:. (1.39) | 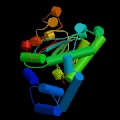 | . | 0.14 | 96 | 15.5 | 3 |
d1grl_3:. (1.39) |  | . | - | 95 | 15.4 | . |
d2sici_:. (1.39) |  | . | . | 91 | 15.3 | . |
d1atia1:. (1.39) |  | . | - | 96 | 15.3 | 3 |
d1vsga_:. (1.39) |  | . | . | 90 | 15.1 | . |
d1dkga2:. (1.39) |  | . | - | 97 | 14.7 | . |
d1rkd__:. (1.39) |  | 1 | 0.25 | 97 | 14.5 | 4 |
d1lbu_1:. (1.39) |  | . | . | 96 | 14.5 | . |
d2prk__:. (1.39) |  | . | 0.38 | 72 | 14.1 | 2 |
d1oelc2:. (1.39) |  | . | - | 95 | 14.1 | . |
d1fsu__:. (1.39) |  | . | 0.16 | 93 | 13.9 | . |
d2chr_2:. (1.39) |  | . | - | 90 | 13.9 | . |
d1tml__:. (1.39) |  | . | . | 90 | 13.8 | 18 |
d1gab__:. (1.39) |  | . | . | 81 | 13.8 | . |
d1vib__:. (1.39) |  | . | . | 95 | 13.7 | . |
d1jud__:. (1.39) |  | . | 0.71 | 96 | 13.4 | 1 |
d1a5t_1:. (1.39) |  | . | - | 98 | 13.4 | 1 |
d1bbl__:. (1.39) |  | . | - | 92 | 13.1 | . |
d1rvv1_:. (1.39) |  | . | - | 95 | 13.0 | 3 |
d1alo_3:. (1.39) |  | 1 | - | 90 | 13.0 | . |
d1smpi_:. (1.39) |  | 1 | . | 92 | 13.0 | 2 |
d2a0b__:. (1.39) |  | 1 | 0.14 | 76 | 12.9 | . |
The images of protein structures were taken from www.rcsb.org
The classification of folds is from SCOP version 1.39
Questions, comments, and suggestions qian@csb.yale.edu